On covid-19 death statistics 5- March 2021 edition
I forgot to do this last week, so here are this month's update of NHS England's weekly covid stats and update my charts.
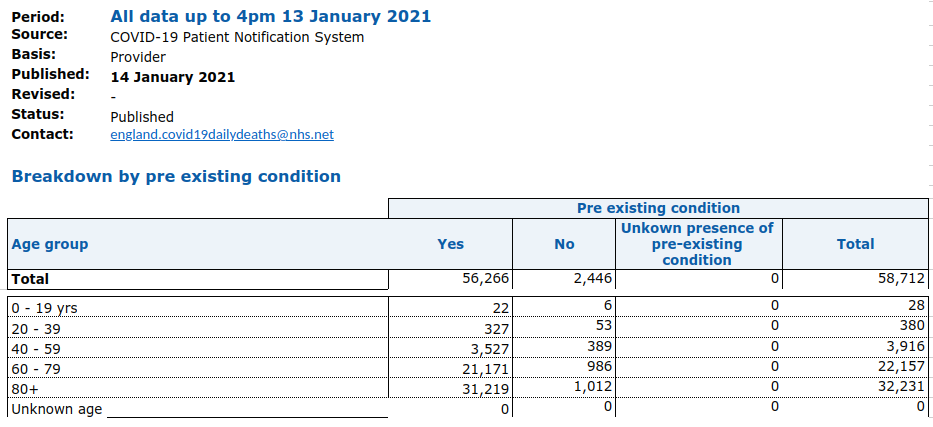
As before, all raw data can be found here, using data up to March 25th.
Following the usual format, first here is here is my updated monthly summary data. Top left is total deaths with or without a pre-existing condition. The bottom left is broken down into age, I have simplified it into under or over 60. To the right in orange are percentage totals.

Next, here is my graph showing total deaths by a pre-existing condition The graph appears to be leveling off, hopefully, the peak will appear next month. 
And here is the graph showing the percentage of deaths by age group and gender. We still see more male deaths in every age group.


Comments
Post a Comment