On covid-19 death statistics
I became aware of this published data a few weeks ago via this Unherd column. Since then I have checked occasionally for updated figures, and last week started to analyse the data.
First I downloaded every data set from this archive page, going back to May 2020 (where the archived data begins, so note that Month will also include all deaths earlier in the year). I was particularly interested in page 3, the deaths by age, and pre-existing conditions. I put each week's figures into a single spreadsheet and made monthly total tables. I then calculated the percentages and made some graphs. I have just updated my data with this week's figures, which I present below.
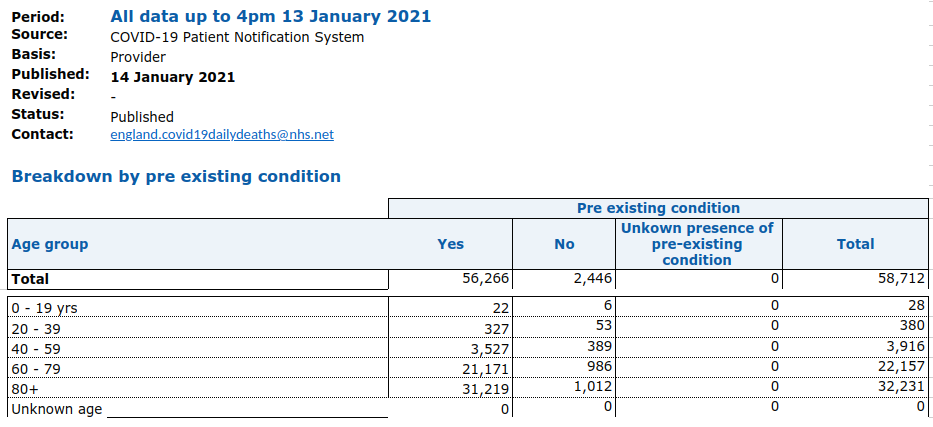
First, here is this weeks data (source)
And here is my % calculations for the totals to date:
And here is my monthly summary data. Top left is total deaths with or without a pre-existing condition. The bottom left is broken down into age, I have simplified it into under or over 60. To the right in orange are percentage totals.
Next, here is my graph showing total deaths by a pre-existing condition. Note the rise in deaths from October onwards.
And finally, here is a graph showing the percentage of deaths by age group.The data is fairly consistent each month, with around 4-5% of deaths having no prior condition, and around 7-9% of those who died were aged under 60. The numbers also seem to be decreasing month on month. I will update these charts at the end of the month with the full January dataset.
I present this data without comment or judgment, you can draw your own conclusions from this regarding current UK government policy. Also please note I have just used data for England, not the whole UK (but would be surprised if there was much difference in the patterns).
Finally, anyone wishing to reproduce or share these images may do so with proper attribution.
Update February 21- see this post for the most up to date stats.


Comments
Post a Comment