On covid-19 death statistics 4- February 2021 edition
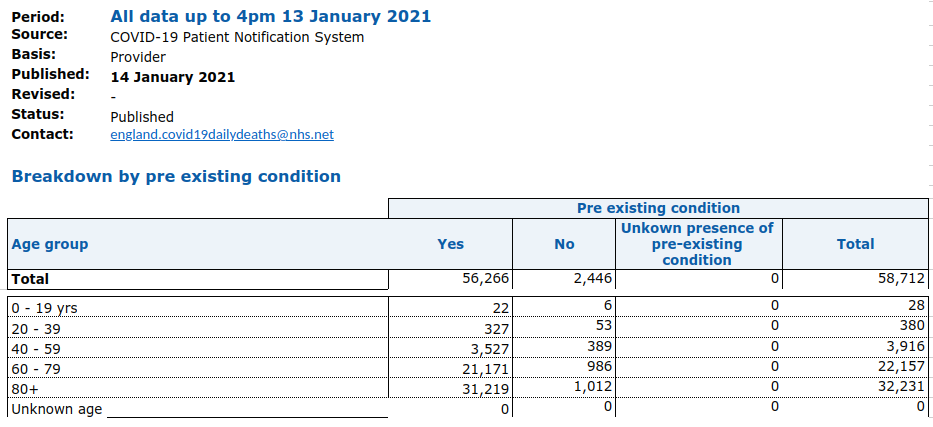
As we near the end of the month, it's time to revisit NHS England's weekly covid stats and update my charts.
As before, all raw data can be found here.
Following the usual format, first here is my % calculations for the totals to date:
And here is my updated monthly summary data. Top left is total deaths with or without a pre-existing condition. The bottom left is broken down into age, I have simplified it into under or over 60. To the right in orange are percentage totals.
Next, here is my graph showing total deaths by a pre-existing condition.
And here is the graph showing the percentage of deaths by age group.
This pie chart shows all deaths by age,
And finally, here is the to date total deaths by gender.
The trends are consistent with those seen in the previous posts in this series.


Comments
Post a Comment